We all know visual content performs better than text alone.
And we depend on a range of tools to create quality visuals for our content.
But sometimes, one tool rises to the top of the list because it’s easy to use, helps you create lots of great looking graphics, and does so for a reasonable price.
Today, I want to tell you about the infographic tool I’ve been using — and absolutely love.
Introducing Visme

I’ve used a lot of design tools, including a handful of different infographic tools, but Visme is the only one that helps me turn my ideas into professional graphics in half the time.
The process is actually fun…
I’ve used it for client projects, turning difficult concepts into visuals that speak louder than words.
I’ve used it in sales pages to create a quick graphic that illustrates a point.
And each time, I only have to scroll through the templates until I find one that suits the information I’m working with, then tweak it to work with my idea, and save.
Adapting the templates is easy. I can rebrand by changing the colors, add or delete entire sections, and once I settle on a design, I can duplicate it for a series of matching graphics.
Infographics, Presentations, and Charts, Oh My!
Up to now, I’ve had to use different tools for different types of graphics. With Visme, you won’t need them. This one tool can help you make just about any type of visual content you need:
- Presentations
- Printables, such as fliers
- Reports
- Social media posts or ads
- Web graphics
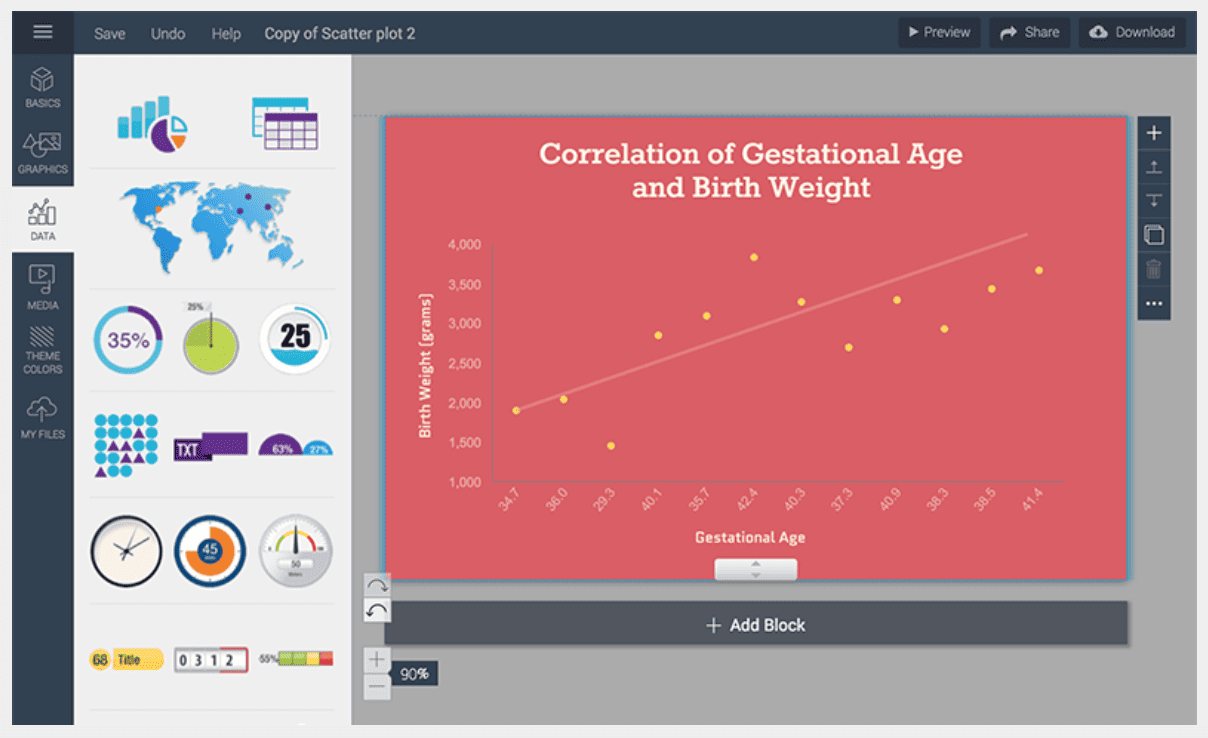
- Scatter plots
- Blog post headers
- Documents
- Custom graphics: you set the dimensions
All you have to do is select the type of project you want… whether you want to create a classic or modern design… and then start editing.
You can add or edit sections (or slides for a presentation), change the colors and themes, insert text and images, add or edit icons — and when you’re done, share online or download.
As for file types, you can create JPG, PNG, HTML, PDF. Whatever you need.
And you’d be surprised at how quickly you can create them. I’ve made in-depth infographics in less than an hour. Something simple, like this social media graphic, takes only a couple minutes.

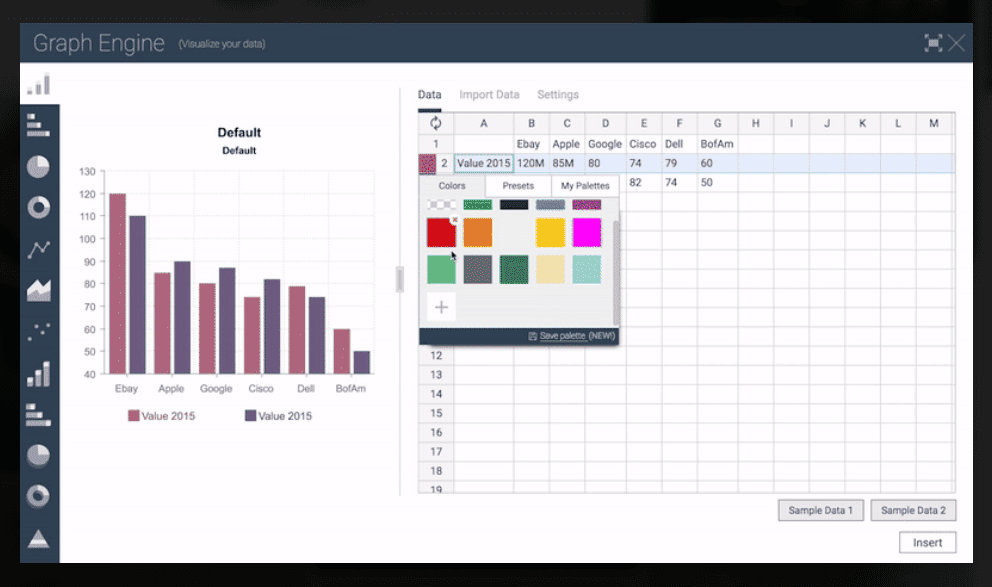
You can also use it to make your graphs…

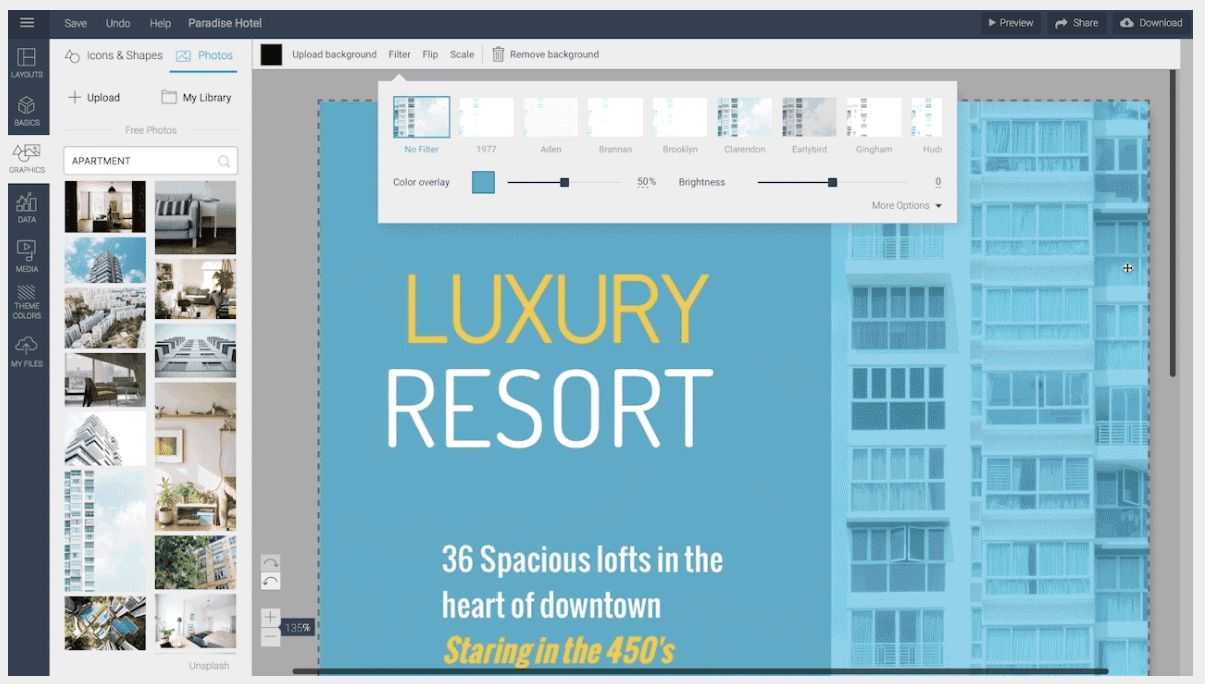
… for fliers and other printables…


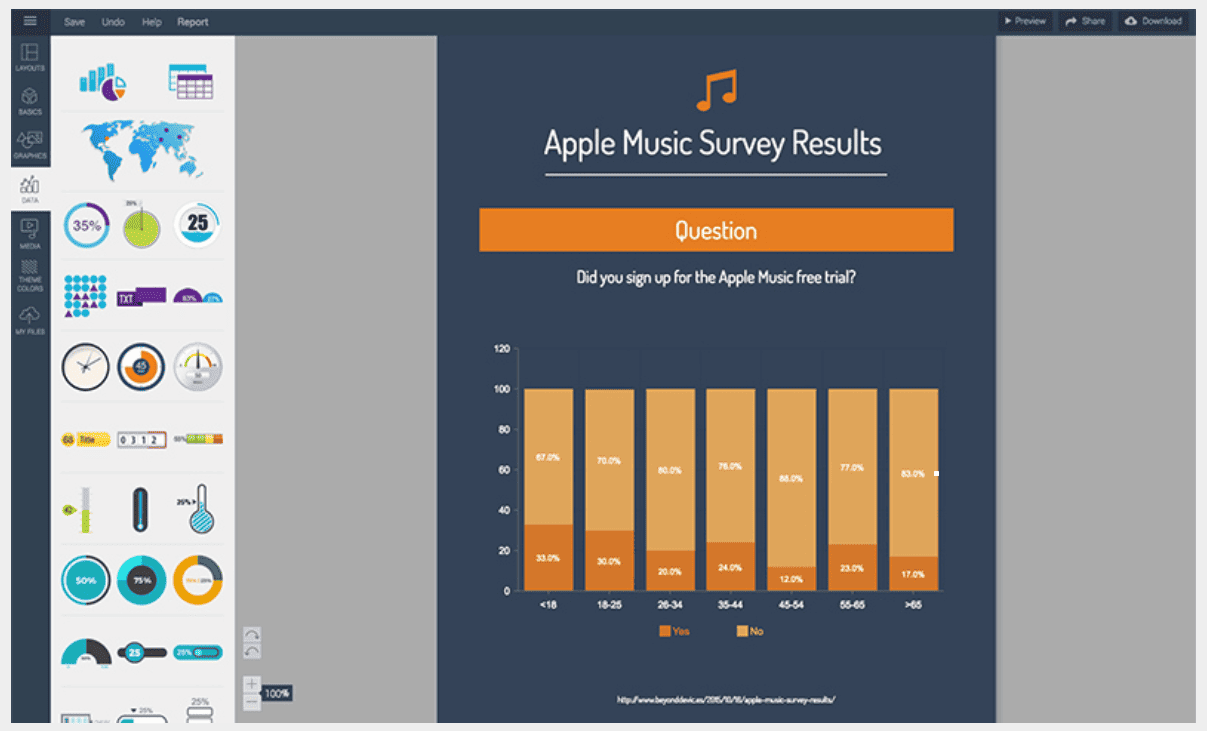
… for publishing survey results, and much, much more.

A Price that Won’t Blow Your Budget
Most graphics tools are overpriced for what they give you. One of the things I like most about Visme is that it’s a truly valuable tool yet still affordable.
There really is a plan for every budget.
If you don’t create a lot of graphics, use the free plan. It lets you create up to 5 projects a month. To create 15 projects a month, you’ll need the Standard plan, at $12/month. For unlimited projects, choose the Complete plan, at $20/month.
Of course, the Complete plan gives you the features you’re most likely to want as a content creator. The ability the download your infographics as PDFs and to duplicate your projects make it well worth the investment.
To know which is right for you, though, you’ll need to evaluate the plans.
Stay Ahead of the Trends
Today, the focus in content marketing isn’t quantity. We’re publishing less often, but when we do, we’re trying to create the highest value possible.
Which means we need to be creating original, well-designed graphics too.
For me, the best tool is intuitive — it knows what I’m trying to do and makes it easy. It also helps me create professional graphics in only a short amount of time. And the price doesn’t make me squirm.
So far, Visme meets all my expectations.
I liked it when it was in beta. But now that it’s out of beta, I’m doubly impressed. With this one tool, you can get most of your graphics taken care of — without having to hire a designer and without having to invest a ton of time.


